
In 2024, organizations generate more data in a single day than many companies produced in an entire year just two decades ago. The challenge isn’t collecting information—it’s making sense of it all. This page is about Business Intelligence (BI) in the context of business and technology, focusing on how BI enables organizations to transform data into actionable insights.
Business Intelligence (BI) transforms this flood of raw data into clear, actionable insights that drive smarter decisions. Whether you’re a retailer tracking seasonal sales patterns, a bank monitoring risk exposure, or a manufacturer optimizing production lines, BI provides the visibility you need to act with confidence.
This guide is for business leaders, analysts, and IT professionals seeking to understand and implement BI. Understanding BI is essential in today's data-driven world because organizations that can harness and interpret their data are better equipped to make informed decisions, respond to market changes, and maintain a competitive edge.
This comprehensive guide walks you through everything you need to know about business intelligence—from foundational concepts and core tools to implementation strategies and emerging trends that will shape the discipline through the late 2020s.
What Does "BI" Mean? (Clarification)
While "BI" is most commonly used to refer to Business Intelligence in business and technology, it can have other meanings in different contexts:
-
In healthcare, "BI" can stand for Biological Indicator, a tool used to verify sterilization.
-
In chemistry, the prefix "bi-" denotes a partially neutralized acid, such as bisulfate or bicarbonate.
-
In medical terminology, "bi-" means "two" or "twice" (e.g., bilateral, biceps).
-
"Bi" is also a common abbreviation for bisexual, a sexual orientation involving attraction to more than one gender.
In various professional contexts, BI primarily stands for Business Intelligence, although it has distinct secondary meanings in healthcare, biology, and chemistry. In this guide, BI refers to Business Intelligence—the strategies, processes, and tools that help organizations make data-driven decisions.
What is Business Intelligence (BI)?
BI is an umbrella term for the strategies, processes, and tools used to collect, manage, analyze, and present business information. Business intelligence (BI) is a set of technological processes for collecting, managing and analyzing organizational data to yield insights that inform business strategies and operations. Rather than relying on gut feeling or anecdotal evidence, BI analyzes current and historical data through reports, dashboards, and visualizations to reveal what’s actually happening in your organization.
At its core, business intelligence focuses on descriptive analytics—answering questions like “what happened” and “what is happening now.” This foundation often feeds into more advanced analytics that predict future outcomes or recommend specific actions.
BI in Practice
Consider a regional retailer that has tracked daily sales by store since 2015. With BI, they can instantly compare this week’s performance against the same week last year, identify which locations are underperforming, and spot emerging product trends before competitors notice.
Or take a commercial bank monitoring loan default rates by region. Their BI dashboards surface early warning signs—perhaps defaults in the Southwest climbing 2.3% month-over-month—enabling proactive risk management rather than reactive damage control.
These aren’t hypothetical scenarios. They represent how thousands of organizations use business intelligence data every day to stay competitive.
Business Intelligence Overview
Modern organizations generate massive data streams from enterprise systems, customer touchpoints, and connected devices. An e-commerce company might pull transaction data from Shopify, customer interactions from Zendesk, marketing metrics from Google Analytics, and inventory levels from warehouse management systems—all before lunch.
Banks process millions of daily transactions across branches, ATMs, mobile apps, and wire transfers. Manufacturers collect sensor readings from production equipment every few seconds. This data explosion, accelerating since cloud BI started maturing around 2010, creates both opportunity and complexity.
The BI Lifecycle
The business intelligence process follows a clear path:
-
Collect data from various sources
-
Integrate it into a unified format
-
Clean and standardize the information
-
Store it in optimized repositories
-
Analyze patterns and metrics
-
Visualize findings through dashboards and reports
-
Act on the insights while monitoring outcomes
Each stage builds on the previous one. Skip data preparation, and your dashboards show garbage. Neglect visualization, and valuable analysis sits unused in spreadsheets.
Connecting Internal and External Data
Effective BI pulls together both internal data (sales figures, financial statements, HR metrics) and external data (market benchmarks, demographic trends, competitive intelligence). A complete picture requires both views.
For instance, knowing your customer acquisition cost dropped 15% in Q1 2024 means little without context. Comparing that metric against industry benchmarks transforms it into an insight worth acting on.
Modern BI platforms connect to dozens of data sources—Salesforce CRM, SAP S/4HANA, Microsoft Dynamics, cloud databases, flat files, and APIs—creating a unified analytical layer across previously siloed systems.
Business Intelligence Definition and Core Concepts
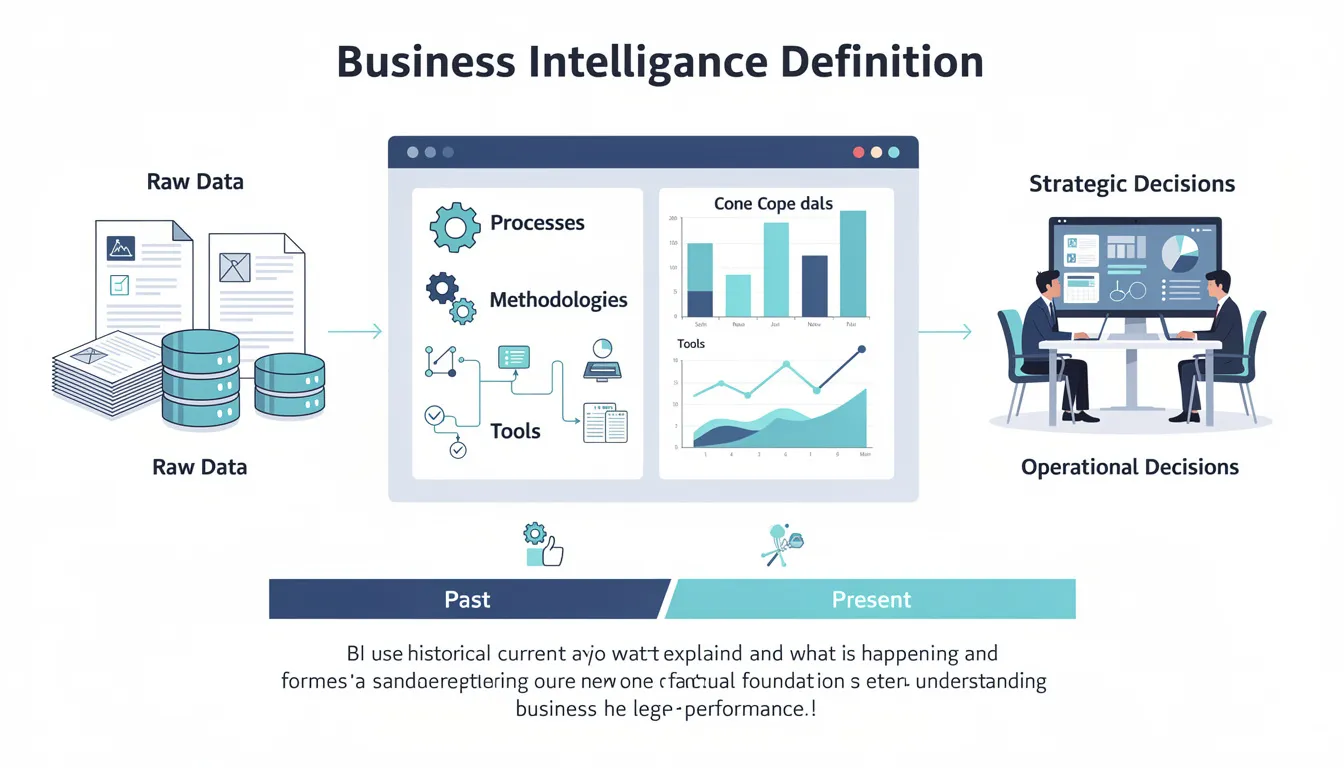
Let’s sharpen the definition: business intelligence encompasses the processes, methodologies, and tools that convert raw data into meaningful information for strategic and operational decisions.
The time orientation matters. BI primarily uses past and present data to explain what happened and what is happening now. It provides the factual foundation for understanding business performance before any predictions or prescriptions enter the picture.
What Makes an Insight Actionable?
An “actionable insight” is more than an interesting observation—it’s information that points directly to a decision or change. Consider this example: your BI dashboard reveals that online conversion dropped 8% in Q2 2024, specifically on mobile devices, specifically during checkout. That’s actionable because it tells you exactly where to investigate and what to fix.
Compare that to knowing simply that “sales were down.” That’s a data point, not an insight.
Core BI Outputs
Business intelligence delivers information through several formats:
-
Scheduled reports arrive automatically—daily sales summaries, weekly marketing performance, monthly financial statements—ensuring stakeholders receive consistent updates without manual effort.
-
Interactive dashboards let users explore metrics in real time, drilling from high-level KPIs into underlying details as questions arise.
-
Ad hoc queries enable one-off analysis when someone asks an unexpected question that standard reports don’t address.
-
Automated alerts notify the right people when metrics cross predefined thresholds—inventory falling below safety stock, customer complaints spiking, or revenue exceeding targets.
Business Intelligence vs. Business Analytics
The terms “business intelligence” and “business analytics” often appear interchangeably, but they serve different purposes.
BI focuses on descriptive analysis of "what happened," while Business Analytics (BA) focuses on predictive/prescriptive analysis of "why" or "what will happen." Both are vital and work together to provide descriptive, diagnostic, predictive, and prescriptive analytics.
Business intelligence is primarily descriptive and diagnostic. It tells you what happened (sales dropped 12% in March), what the current state looks like (we have 847 open support tickets), and sometimes why (the drop correlates with a pricing change). BI relies heavily on key performance indicators, historical data, and structured reporting.
Business analytics focuses more on predictive and prescriptive questions. What’s likely to happen? Which customers will churn next quarter? What pricing strategy will maximize margin? Analytics employs statistical modeling, machine learning, and scenario simulation to look forward rather than backward.
A Side-by-Side Example
Imagine you’re analyzing customer retention:
-
BI approach: A dashboard shows the last 24 months of customer churn by segment, revealing that enterprise clients have 94% retention while small business clients hover at 71%. You can see exactly when the gap widened and correlate it with product changes or market conditions.
-
Analytics approach: A predictive model scores each current customer’s likelihood to churn in Q1 2025, flagging the 200 accounts most at risk so your success team can intervene proactively.
In practice, many modern BI platforms like Microsoft Power BI, Tableau, and Looker bundle both capabilities. The disciplines complement each other—BI provides the foundation of understanding, while analytics extends that understanding into forecasts and recommendations.
Key Benefits of Business Intelligence

The fundamental benefit of business intelligence is simple: decisions grounded in facts outperform decisions based on intuition. But that broad statement understates BI’s impact across organizations.
Faster, More Confident Decisions
When executives, managers, and frontline employees can access relevant data within minutes rather than days, decision velocity increases dramatically. A regional manager wondering whether to extend a promotion doesn’t need to request a report and wait until next week. The answer sits in their dashboard, updated this morning.
This speed compounds. Faster decisions lead to faster execution, which captures opportunities before competitors react.
Measurable Financial Impact
Organizations with mature business intelligence programs consistently report higher revenue, lower costs, and improved margins. A retail chain reduced out-of-stock incidents by 15% in 2023 using inventory dashboards that flagged replenishment needs before shelves emptied. That translates directly to captured sales that would otherwise walk out the door.
A regional bank identified risky loan portfolios three months earlier than their previous quarterly review process allowed, reducing write-offs and improving financial performance.
Enhanced Customer and Employee Experiences
BI isn’t just about financial metrics. Analyzing data on customer behavior reveals friction points in the buying journey. Tracking employee satisfaction surveys surfaces retention risks before valued team members start interviewing elsewhere.
Organizations that understand their stakeholders—through data insights rather than assumptions—build stronger relationships and more sustainable operations.
Competitive Advantage Through Timing
Markets shift constantly. Timely BI—hourly dashboards, real-time alerts, continuous monitoring—helps organizations spot changes before competitors. Recognizing a shift in market trends a week earlier than your competition creates opportunities that slower organizations miss.
The companies that win aren’t always smarter. Often, they simply see reality sooner.
Business Intelligence Tools and Systems

Business intelligence tools are integrated software environments that collect, prepare, analyze, and present data from across the organization. Leading BI platforms include Microsoft Power BI, Tableau, Qlik Sense, SAP Analytics Cloud, Looker, and dozens of specialized alternatives.
Integration Capabilities
Modern BI systems connect to virtually any data source—cloud databases, on-premises data warehouses, SaaS applications, spreadsheets, and APIs. This connectivity matters because most organizations store important data in multiple systems that don’t naturally communicate.
Power BI connects to over 100 data sources out of the box. Tableau offers similar breadth. The goal is a unified analytical view regardless of where data originates.
Self-Service for Business Users
One of the most significant shifts in business intelligence technology over the past decade is the rise of self-service BI tools. Traditional BI required technical specialists to build every report. Modern platforms allow business users—marketing managers, sales directors, operations leads—to create data visualizations and explore metrics without writing code.
This democratization accelerates insight delivery. Instead of submitting a request to IT and waiting two weeks, a marketing analyst can answer their own questions in an afternoon.
Deployment Models
BI solutions deploy in three primary models:
-
On-premises installations run in company data centers, offering maximum control but requiring significant infrastructure investment and maintenance.
-
Cloud-based platforms like AWS QuickSight, Google Looker Studio, and cloud versions of Power BI and Tableau have dominated new deployments since around 2015, offering lower upfront costs, automatic updates, and elastic scalability.
-
Hybrid approaches combine both, often keeping sensitive data on-premises while leveraging cloud capabilities for broader access and advanced features.
Scalability and Performance
Enterprise BI solutions handle billions of rows and thousands of concurrent users. They connect to data lakes, columnar databases, and in-memory engines optimized for analytical queries. Whether your organization has 50 employees or 50,000, properly architected BI scales with you.

BI Reporting
BI reporting delivers structured summaries with tables, charts, and KPIs tailored for specific audiences. A CFO receives a monthly P&L report for January 2024 showing revenue, expenses, and margin by business unit. A marketing director gets a weekly performance summary by campaign and channel.
Reports follow predictable cadences—daily operational summaries, weekly team updates, monthly executive reviews, quarterly board packages. This rhythm ensures everyone works from consistent, timely information.
-
Scheduled reports arrive automatically via email or portal, eliminating manual distribution.
-
Ad hoc reports address one-time questions that fall outside standard templates.
Well-designed reports share common characteristics: clean layouts, clear labels, consistent timeframes, and explicit definitions for each metric. Ambiguity creates confusion; precision builds trust.
Querying and Ad Hoc Analysis
Beyond static reports, BI enables dynamic querying—the ability for users to ask targeted questions of their data. These range from simple filters (“Show me Q3 results for the West region”) to complex multi-dimensional analysis (“Compare revenue by product category for EMEA in Q3 2023 versus Q3 2022, broken down by customer segment”).
Modern analytics tools make this accessible through drag-and-drop interfaces. Some platforms now support natural language queries: type “Which region had the highest return rate in 2022?” and receive an instant answer.
This flexibility matters because not every question can be anticipated. Ad hoc analysis lets business analysts explore data-driven insights without waiting for developers to build new reports.
BI Dashboards
Dashboards are interactive, real-time or near-real-time views of key metrics tailored to specific roles. A sales leader sees pipeline for 2024 by stage, quota attainment by rep, and win rates by deal size. A supply chain manager monitors on-time delivery percentage by warehouse, carrier performance, and inventory turns.
Common dashboard elements include:
-
KPI tiles showing current values with trend indicators
-
Charts visualizing patterns over time or comparisons across categories
-
Maps for geographic analysis
-
Filters enabling users to slice by date, region, product line, or other dimensions
Effective dashboards follow design principles: prominent KPIs at the top, consistent color schemes (red for bad, green for good), minimal clutter, and responsive layouts that work on desktop, tablet, and mobile screens.
The best dashboards answer the five questions every manager asks: Where are we? Where should we be? What’s changed? Why did it change? What should we do?
Data Visualization
Data visualization uses charts, graphs, maps, and infographics to reveal trends, outliers, and relationships more clearly than raw tables ever could. Humans process visual information faster than numbers in rows—a well-designed chart communicates in seconds what a spreadsheet takes minutes to convey.
Certain visuals suit specific purposes:
|
Visualization Type |
Best Used For |
Example |
|---|---|---|
|
Line charts |
Trends over time |
Monthly revenue from 2018-2024 |
|
Bar charts |
Category comparisons |
Revenue by product line |
|
Heatmaps |
Intensity across dimensions |
Regional performance by quarter |
|
Scatter plots |
Relationship between variables |
Price vs. volume correlation |
|
Pie charts |
Part-to-whole (use sparingly) |
Market share distribution |
Effective visualization supports storytelling. Rather than overwhelming users with every available chart type, focus on the narrative: “Why did margin drop in Q4 2023?” Then build visuals that answer that specific question.
Limit visual types per page, use accessible color palettes, and include clear legends and titles. Every chart should be interpretable without explanation.
OLAP and Multidimensional Analysis
Online analytical processing enables fast, multidimensional analysis across dimensions like time, geography, product, and customer segment. OLAP technology, foundational to enterprise BI since the early 2000s, allows users to “slice and dice” data interactively.
The classic example: start with total 2023 revenue, drill down to continent, then country, then city, then individual store—all in seconds. Each click reveals more granular detail while maintaining context.
Behind the scenes, OLAP cubes or columnar databases pre-aggregate data to enable this speed. Users don’t need to understand the technology; they simply click and explore.
This capability transforms how business users interact with data. Instead of requesting a report and waiting, they navigate through dimensions to find their own answers.
Data Preparation and Data Warehouse
Before analysis comes preparation. Data preparation (often called ETL or ELT) involves extracting data from sources like ERP systems, CRM platforms, and spreadsheets, transforming it through cleaning, combining, and standardizing, then loading it into centralized storage.
A data warehouse is that centralized repository—a curated, historical collection optimized for BI queries rather than transactional operations. Modern cloud data warehouses like Snowflake, Google BigQuery, and Azure Synapse have become the backbone of enterprise BI.
Consider a practical example: daily sales and inventory data from 200 stores loads overnight into a warehouse. By 7 AM, dashboards reflect yesterday’s complete activity, and managers start their day with accurate numbers.
The principle is straightforward: high-quality, consistent data forms the foundation of trustworthy business intelligence. Garbage in, garbage out remains as true today as it was decades ago.
How the Business Intelligence Process Works
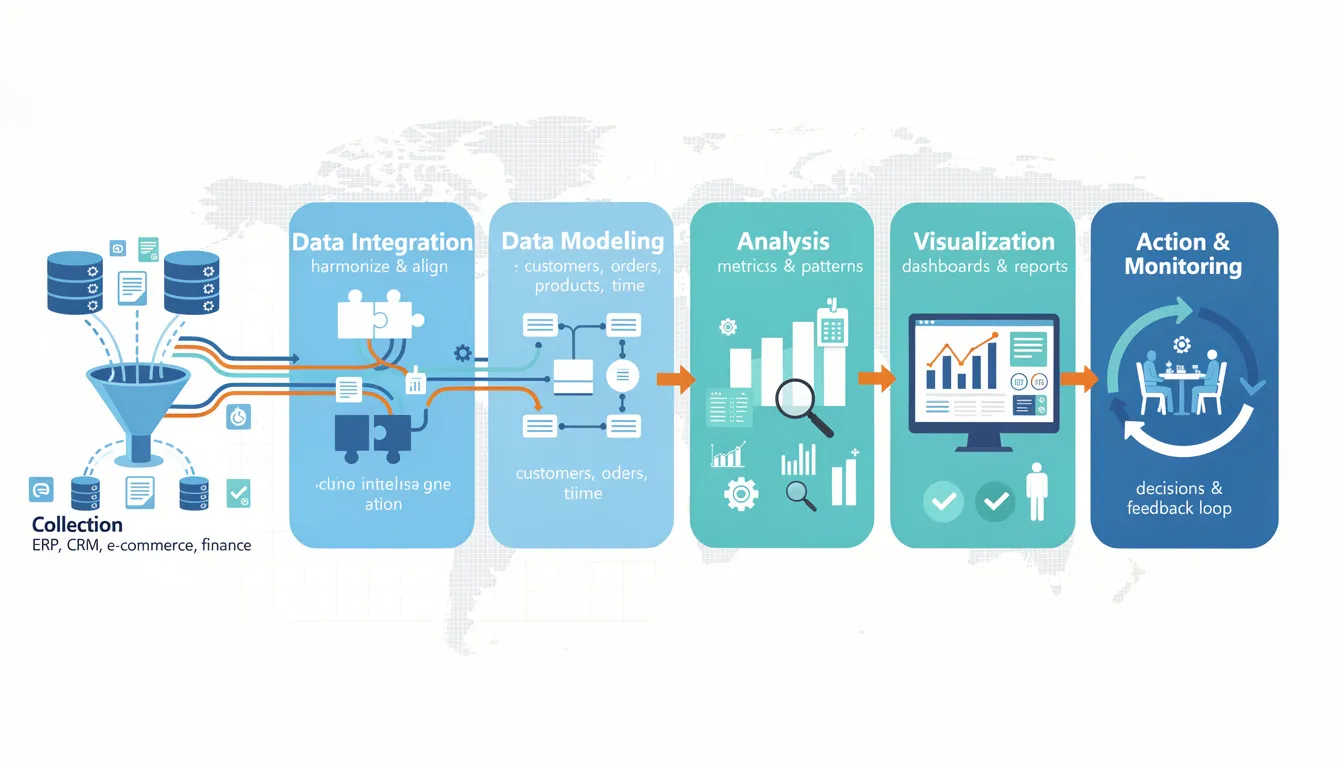
Understanding the end-to-end BI workflow clarifies how organizations transform raw data into informed business decisions.
-
Data Collection: Sources across the organization—ERP, CRM, e-commerce platforms, financial systems—generate data continuously. This structured and unstructured data must be captured systematically.
-
Data Integration: Multiple data sources rarely speak the same language. Integration harmonizes formats, aligns naming conventions, and links related records across systems.
-
Data Modeling: Analysts design data models that organize information logically—defining relationships between entities like customers, orders, products, and time periods.
-
Analysis: With clean, modeled data, analysts calculate metrics, identify patterns, and surface insights. This stage answers the questions stakeholders care about.
-
Visualization: Findings become dashboards, reports, and presentations that communicate insights clearly to decision makers.
-
Action and Monitoring: Insights drive decisions. Those decisions produce results. BI monitors outcomes, feeding back into continuous improvement.
A Concrete Example
Consider a mid-sized retailer in 2024 consolidating online and in-store data to understand omnichannel customer behavior. Data engineers extract transaction logs from the e-commerce platform, point-of-sale data from physical stores, and customer profiles from the CRM. They integrate these into a cloud warehouse, linking online and offline purchases to individual customers.
BI developers build dashboards showing cross-channel purchase patterns. Analysts discover that customers who browse online before buying in-store spend 34% more than single-channel shoppers. This insight shapes marketing strategy, store layouts, and staff training.
The business intelligence process isn’t a one-time project—it’s continuous. Data flows, insights emerge, decisions happen, and the cycle repeats.
Common Business Intelligence Use Cases
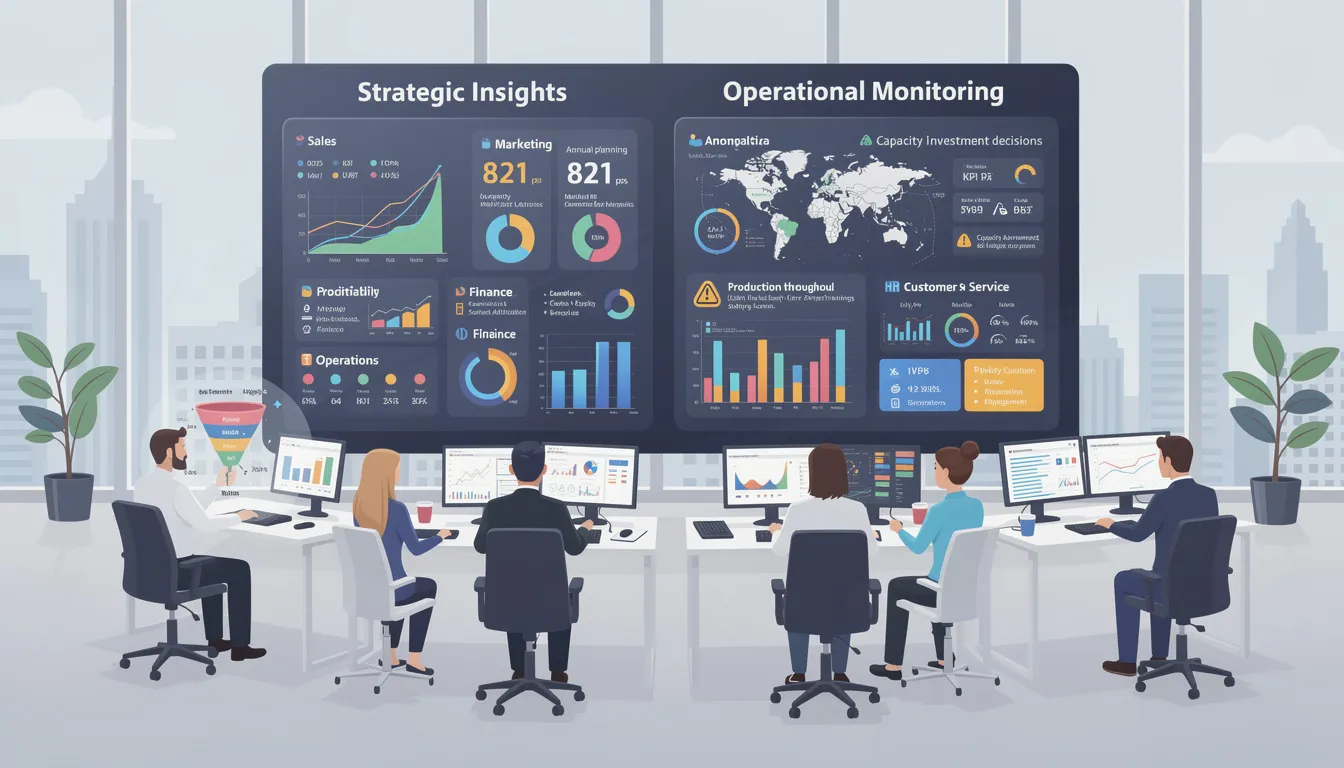
BI is cross-functional, supporting decisions in sales, marketing, finance, operations, HR, and customer service. Use cases span both strategic questions (annual planning, market entry, capacity investment) and operational needs (daily monitoring, issue detection, resource allocation).
Reporting and Performance Monitoring
Routine management reporting forms the backbone of BI usage. Monthly board packs summarize company performance against strategic objectives. Weekly sales reports track pipeline and closed revenue. Daily operational summaries flag production issues or service delays.
Examples include:
-
Tracking revenue versus target for 2024, broken down by quarter, region, and product line
-
Monitoring SLA compliance in a support center—average response time, resolution rate, escalation frequency
-
Reviewing manufacturing output versus plan, identifying equipment utilization gaps
Standardized reports align leadership on a single version of the truth. When everyone sees the same numbers, meetings focus on decisions rather than debating whose spreadsheet is correct.
Data Visualization for Faster Insight
Visualization lets managers detect anomalies and trends quickly. A sudden spike in returns during March 2024 in the Northeast region jumps off a chart in ways it wouldn’t in a table of numbers.
Combining multiple metrics in a single visual prevents siloed analysis. Showing margin and volume together reveals whether growth is profitable. Displaying traffic and conversion on the same timeline highlights whether marketing drives quality visits or just quantity.
Interactive elements—filters, drill-downs, highlight actions—enable users to move from high-level overview to root cause investigation within the same dashboard.
Predictive Analytics and Data Mining in BI
While business intelligence is primarily descriptive, many BI platforms now embed advanced analytics capabilities. Forecasting models predict demand for a product line in Q2 2025 based on seasonal patterns and promotional calendars observed since 2019.
Data mining identifies hidden patterns—which product bundles customers typically purchase together, which customer attributes correlate with high lifetime value, which behaviors precede churn.
Anomaly detection flags unusual transactions for fraud investigation, surfacing the needle in a haystack of legitimate activity.
These extensions don’t replace BI’s descriptive foundation; they build upon it, enhancing forward-looking decision support.
Real-Time and Complex Event Processing
Modern BI analyzes streaming data from payment gateways, sensor networks, and live web logs. This real-time capability matters when speed is essential.
Consider monitoring stock levels during Black Friday sales. A batch report updated overnight would be useless; products sell out in hours. Real-time dashboards track inventory by minute, triggering automatic replenishment orders or marketing pauses when stock runs low.
Energy utilities monitor grid sensor data for outage detection. Manufacturing plants track machine performance to catch failures before they cascade. Customer service operations watch call volumes in real time to adjust staffing.
The business impact: faster response to incidents, reduced downtime, and enhanced customer experience during critical periods.

Industry-Specific Applications of BI
While BI concepts are universal, each industry applies them differently based on unique KPIs, data sources, and operational priorities.
Retail and E-Commerce
Retailers use BI for sales analysis by store, channel, and product category, plus inventory and supply chain monitoring. Key metrics include average order value, conversion rate, basket size, stockout rate, and inventory turns.
Practical applications:
-
Analyzing regional differences in 2023 holiday season sales to optimize 2024 inventory positioning
-
Tracking stockout rates across warehouses to improve demand forecasting
-
Measuring promotional performance: campaign lift, coupon redemption rates, and basket size before and after campaigns
Visual formats like geo maps show store performance at a glance. Time-series charts reveal seasonal demand patterns that inform buying decisions months in advance.
Sales and Marketing
Sales BI covers pipeline tracking, win-loss analysis, territory performance, and quota attainment. Marketing BI addresses channel attribution, campaign ROI, customer lifetime value, and lead conversion metrics.
Examples:
-
Monitoring MQL-to-SQL conversion rate in H1 2024 to optimize lead scoring
-
Tracking email open and click-through rates by customer segment
-
Analyzing win rates by competitor, deal size, and sales rep tenure
Aligning sales and marketing dashboards around shared performance metrics reduces friction between teams and improves collaboration on revenue goals.
Finance and Banking
Banks and financial institutions use BI to monitor profitability, risk, liquidity, and regulatory metrics. The 2008 financial crisis reforms increased reporting requirements, making robust BI essential for compliance.
Use cases include:
-
Daily liquidity dashboards ensuring capital adequacy
-
Branch-level performance scorecards comparing profitability across locations
-
Risk heatmaps by product and geography
-
Credit scoring monitoring and fraud detection alerts
Accuracy and auditability are paramount. Financial data requires controlled access, versioning, and clear lineage to satisfy regulators and auditors.
Healthcare
Hospitals and clinics use BI to track patient flow, wait times, treatment outcomes, and resource utilization. Compliance and regulatory reporting—standardized across the EU and US since the 2010s—demands reliable data infrastructure.
Key metrics:
-
Bed occupancy rates by department and time of day
-
Emergency department wait times by acuity level
-
Medication stock levels preventing stockouts of critical supplies
-
Readmission rates by diagnosis group, identifying quality improvement opportunities
Dashboards tailored for clinical leaders emphasize patient outcomes. Those for administrators focus on cost control and operational efficiency.
Customer Service and Experience
BI consolidates customer touchpoint data from call centers, chatbots, email, and social media into unified views. This comprehensive picture reveals how customers actually experience your organization.
Metrics include average handle time, first-contact resolution, customer satisfaction (CSAT), and Net Promoter Score by queue and agent.
Beyond aggregate metrics, BI identifies bottlenecks in customer journeys—perhaps high abandonment at a specific checkout step, or excessive transfers between support queues.
Typical dashboards display:
-
Queue metrics with real-time wait times
-
Sentiment trends from customer feedback
-
Heatmaps of contact reasons by channel and time
Understanding customer data at this level enables targeted improvements rather than generic initiatives.
Data Governance and Data Management for BI
Data governance is the framework of policies, standards, and roles ensuring data is accurate, secure, and used appropriately. Without governance, BI becomes unreliable.
Consider the common problem of inconsistent KPI definitions. If Marketing calculates “active customer” as anyone who logged in during the past 90 days, but Finance counts only those who made a purchase, reports will conflict. Leaders lose trust in the numbers and revert to spreadsheets.
Strong data management processes prevent this chaos through:
-
Standardized definitions documented and enforced across the organization
-
Access controls ensuring the right people see appropriate data
-
Privacy compliance meeting GDPR (2018), CCPA (2020), and other regulations
-
Data quality monitoring catching errors before they reach dashboards
The balance is delicate: enable self-service BI so business users can explore data independently, while preventing conflicting or biased interpretations.
Building Strong Data Management Processes
Effective data management requires investment in several areas:
-
Standardized data pipelines extract, transform, and load data consistently. When every team builds their own ETL jobs, inconsistencies multiply.
-
Metadata management documents what each field means, where it comes from, and how it’s calculated. This context prevents misinterpretation.
-
Master data management (MDM) maintains single, trusted records for key entities—customers, products, locations, employees. When everyone uses the same product catalog, BI comparisons become meaningful.
Practical examples: maintaining a single product hierarchy used by BI across all regions, or agreeing on naming conventions for date fields (always YYYY-MM-DD) and currencies (always in USD, conversion clearly labeled).
Ongoing discipline matters as much as initial setup. Regular data quality checks, reconciliation with source systems, and documentation of data lineage keep the foundation solid.
Selecting the Right BI Tools
Choosing the right BI software depends on multiple criteria:
|
Criterion |
Considerations |
|---|---|
|
Integration |
Does it connect to your existing data sources and systems? |
|
Ease of use |
Can business users build reports without extensive training? |
|
Scalability |
Will it handle your data volumes as you grow? |
|
Security |
Does it meet your governance and compliance requirements? |
|
Cost model |
Subscription vs. perpetual license; per-user vs. capacity-based pricing |
Context shapes the right choice. A small startup in 2025 might choose a cloud-native tool with low initial cost and quick setup. A large enterprise might standardize on a comprehensive suite that integrates with existing technology investments.
Different departments may need specialized analytics tools alongside core BI—embedded analytics in customer-facing products, advanced notebooks for data scientists, planning modules for finance.
Map tools to user personas (executives need mobile-friendly summaries; analysts need detailed exploration) and to concrete reporting needs (what reports must we produce, and when?).
Uncovering Trends, Inconsistencies, and Bias
BI and data mining can reveal important patterns: declining margins in a product line over six quarters, customer churn increasing in a specific segment, operational costs rising faster than revenue.
They can also surface anomalies—sharp spikes or drops that demand investigation. Is the spike a data quality issue, a one-time event, or the beginning of a new trend?
But BI also carries risks. Unconscious bias in interpreting visualizations leads analysts to see what they expect rather than what the data actually shows. Cherry-picking metrics—highlighting favorable numbers while ignoring unfavorable ones—undermines trust.
Mitigations include:
-
Using standardized definitions so metrics mean the same thing everywhere
-
Peer review of dashboards before they reach executives
-
Clear documentation of assumptions, filters, and exclusions
-
Training on statistical interpretation to avoid common fallacies
The goal is data-driven decisions, not decisions dressed up with data to support predetermined conclusions.
Implementing a BI Program
Building a successful BI program follows a structured approach:
-
Define strategy and scope — What business questions must BI answer? Which decisions will it support?
-
Gather requirements — Interview stakeholders across departments to understand their reporting needs
-
Design architecture — Plan data flows, warehouse structure, and tool integration
-
Select tools — Evaluate options against your requirements (see criteria above)
-
Build data models — Create the logical structures that organize your business information
-
Develop content — Build dashboards, reports, and automated alerts
-
Train users — Ensure everyone knows how to access and interpret BI outputs
-
Iterate and improve — Expand scope based on feedback and evolving needs
A typical mid-sized implementation runs 6-12 months from initial strategy work in early 2024 to organization-wide rollout. Simpler deployments can move faster; complex enterprises may take longer.
Change management matters as much as technology. Communication plans keep stakeholders informed. Executive sponsorship signals organizational commitment. User training sessions build comfort and capability.
Organizational Challenges of BI
Real-world BI implementations face predictable hurdles:
-
Poor data quality undermines trust. If users spot errors in dashboards, they’ll revert to their own spreadsheets regardless of how polished the BI tool looks.
-
Fragmented ownership creates conflict. Which team defines “customer”? Who owns the sales pipeline report? Without clear governance, departments build competing versions.
-
Lack of clear KPIs leaves BI unfocused. If leadership can’t articulate which metrics matter most, BI teams build everything, and nothing gets adopted.
-
Resistance to change is human nature. People comfortable with familiar processes resist new tools, especially if those tools reveal uncomfortable truths.
Mitigation strategies:
-
Launch data quality projects before BI deployment, not after
-
Establish governance councils with cross-functional representation
-
Appoint BI champions in each department to drive adoption
-
Start with small pilots that demonstrate quick wins before scaling
Funding, ROI, and Long-Term Value
BI requires upfront investment in technology, skills, and process changes. ROI typically materializes over multiple years rather than quarters.
Building a business case requires identifying concrete benefits:
-
Time savings: Hours spent manually creating reports multiplied by analyst salaries
-
Error reduction: Cost of mistakes in financial statements or forecasts
-
Revenue capture: Sales recovered from better inventory management or faster pricing decisions
-
Cost avoidance: Waste eliminated through operational visibility
Before/after comparisons strengthen the case: compare pre-BI 2022 performance against post-implementation 2024 results on specific metrics.
Set realistic expectations with executives. BI is infrastructure, not magic. Benefits compound over time as adoption spreads and data quality improves.
Modern Trends and the Future of BI
Business intelligence continues evolving rapidly. Several trends are reshaping the discipline:
-
Augmented analytics uses machine learning to automate insight discovery, suggesting patterns and anomalies that analysts might miss.
-
AI-assisted insights go further, with platforms generating natural language explanations of chart movements and recommending next steps.
-
Natural language query lets users ask questions in plain English rather than learning query syntax or navigation paths.
-
Embedded analytics integrates BI directly into operational applications—CRM, ticketing systems, collaboration tools—so insights appear where work happens.
Since around 2020, vendors have increasingly bundled these capabilities together. The distinction between BI, data science, and automation blurs as platforms handle more complexity automatically.
The result: faster decisions, broader adoption across technical and non-technical users, and insights woven into daily workflows rather than siloed in separate applications.
Modern BI and Analytics Platforms
Cloud platforms now combine BI, financial planning, and advanced analytics in single environments accessible via browser and mobile app.
Practical capabilities include:
-
Sharing dashboards globally with distributed teams through secure web links
-
Embedding analytics into customer-facing products (giving clients their own performance views)
-
Anomaly detection that automatically flags unusual metrics
-
Automated forecasting that projects trends without manual modeling
-
AI-generated narratives explaining why a metric changed
These features democratize data access. When the CEO can explore company data from their phone during a flight, and a store manager can check performance metrics on a break room tablet, data literacy spreads organically.
The Future of BI in Organizations
Looking toward the late 2020s, several developments seem likely:
-
Deeper integration with productivity tools: BI will embed more fully into email, collaboration suites, and everyday applications. Instead of opening a separate BI portal, insights will surface contextually—a meeting invite about Q3 performance will include relevant charts automatically.
-
Stronger governance and compliance: As data privacy regulations multiply globally, BI platforms will need more sophisticated controls over who sees what, with detailed audit trails.
-
More automation in data preparation: The most time-consuming BI work—cleaning and integrating company data—will increasingly be handled by AI, freeing analysts for higher-value interpretation.
-
Growing emphasis on data literacy: Organizations will invest more in training employees to interpret and question data, reducing the risk of misuse while accelerating adoption.
-
Convergence into decision intelligence: BI, data analytics, and operational analytics will merge into unified platforms focused on the outcome—better decisions—rather than the technical distinctions between disciplines.

Key Takeaways
-
Business intelligence transforms raw data into actionable insights that inform business strategies across all organizational functions
-
Modern BI tools enable self-service access, allowing business users to build reports and explore data without coding expertise
-
A solid data warehouse and strong data management processes form the foundation of reliable BI outcomes
-
BI delivers descriptive analytics (what happened), while business analytics extends into predictive and prescriptive territory
-
Successful BI implementation requires executive sponsorship, clear governance, and attention to change management
-
Industry-specific applications range from inventory optimization in retail to risk monitoring in finance to patient flow analysis in healthcare
-
Modern trends including augmented analytics, natural language query, and embedded BI are making insights more accessible than ever
Conclusion
Organizations that understand their data make better decisions. It’s that straightforward.
Business intelligence provides the visibility, consistency, and speed that transform scattered information into competitive advantage. Whether you’re tracking financial performance, analyzing customer behavior, or monitoring business operations, BI surfaces the insights that drive informed action.
The technology has matured dramatically. Cloud platforms offer enterprise capabilities at startup-friendly prices. Self-service tools put power in the hands of business users. AI-assisted features automate what once required specialized skills.
But technology alone isn’t enough. Successful BI requires clean data, clear governance, and organizational commitment to data-driven decisions. It requires asking hard questions and accepting honest answers, even when those answers are uncomfortable.
Start by assessing your current data landscape. Identify the decisions that would benefit most from better information. Pilot a modern BI tool with a focused use case. Build from there.
The organizations investing in business intelligence capabilities today will be more resilient, more responsive, and more competitive tomorrow. The question isn’t whether BI matters—it’s whether you’re ready to act on what the data tells you.
Frequently Asked Questions (FAQs) about Business Intelligence
What does "BI" stand for in business and technology?
In business and technology, "BI" primarily stands for Business Intelligence, referring to the strategies, processes, and tools used to collect, manage, analyze, and present business information to support decision-making. In various professional contexts, BI primarily stands for Business Intelligence, although it has distinct secondary meanings in healthcare, biology, and chemistry.
What are some common BI tools used in organizations?
Popular business intelligence platforms include Microsoft Power BI, Tableau, and Google Looker. These tools are renowned for their ability to facilitate self-service analytics, allowing business users to explore data and generate insights without heavy reliance on IT. Tableau, in particular, is recognized as a leader in advanced data visualization and complex analysis, helping organizations turn intricate data sets into understandable visual stories.
How does BI help in optimizing business operations?
BI can identify underperforming areas and redundant processes within an organization, enabling resource optimization and cost reduction. By analyzing performance metrics and operational data, businesses can streamline workflows, eliminate inefficiencies, and focus efforts where they will have the greatest impact.
What role does data visualization play in BI?
Data visualization is central to business intelligence. It transforms complex datasets into easy-to-understand charts, graphs, dashboards, and maps that make trends, outliers, and patterns immediately apparent—even to non-technical stakeholders. Visualization is used throughout BI systems, appearing in reports, as answers to ad hoc queries, and within interactive dashboards, all designed to enhance data comprehension and support informed decision-making.
How does real-time performance tracking work in BI?
Modern BI solutions often include real-time processing capabilities, allowing managers to monitor key performance indicators (KPIs) interactively. This immediate visibility enables swift operational adjustments, helping organizations respond quickly to changing conditions and maintain optimal performance.
What is Online Analytical Processing (OLAP) and why is it important?
OLAP is a technology that supports fast, multidimensional analysis of large volumes of data stored in data warehouses or other centralized repositories. It allows users to "slice and dice" data across various dimensions such as time, geography, and product categories, facilitating deep insights and flexible exploration of business information.
Why are cloud-based BI tools gaining popularity?
Cloud-based business intelligence platforms excel at handling streaming data and large data volumes, offering scalability, flexibility, and easier deployment compared to traditional on-premises solutions. They support continuous data integration and provide access to BI capabilities from anywhere, making them ideal for modern, distributed organizations.
How does BI transform raw data into actionable insights?
BI tools collect and prepare raw data from multiple sources, then transform it into accessible formats such as dashboards, charts, and reports suitable for all levels of users. This transformation enables decision-makers to quickly grasp complex information and act on insights to improve business outcomes.
Can BI tools be used by non-technical users?
Yes. Many modern BI platforms emphasize self-service analytics, empowering business users without advanced technical skills to create data visualizations, run queries, and generate reports. This democratization of data access accelerates insight delivery and fosters a data-driven culture across the organization.
Contact Sterling Media & Communications
Ready to transform your business with powerful insights and data-driven decisions? Sterling Media & Communications is here to help you harness the full potential of business intelligence. Visit smcww.co.uk to learn more about their expert BI solutions and how they can support your organization's growth and success. Take the first step toward smarter business strategies today!

0 comments