
Introduction to Web Performance Testing
Web performance testing is crucial for ensuring a seamless user experience on web apps and web pages. Slow loading times, poor accessibility, and SEO issues can negatively impact user engagement and search engine rankings. To address these challenges, web developers rely on tools that provide comprehensive insights into website performance.
This guide is intended for web developers and site owners who want to use npm Lighthouse to audit and optimize their websites. This guide focuses on using npm Lighthouse, the Node.js package version of Google Lighthouse, for web performance testing. Using npm Lighthouse enables automated, repeatable performance audits directly from your development workflow.
Lighthouse is a free, open-source, automated tool developed by Google that helps improve the quality of web pages. As a developer-centric solution, Lighthouse supports developers in optimizing, auditing, and monitoring website performance. It offers detailed audits covering website performance, accessibility, SEO, best practices, Progressive Web App (PWA) compliance, and more. Lighthouse provides the ability to deliver actionable insights and features that help users identify and resolve issues efficiently.
The npm Lighthouse package allows you to run audits programmatically via the command line or within a Node.js environment. This makes it especially valuable for integrating performance testing into automated workflows and CI/CD pipelines. The reports generated by Lighthouse include in-depth details about performance metrics and recommendations, enabling developers to optimize their sites for speed, usability, and search engine discoverability.
With this foundation, let’s move on to setting up npm Lighthouse for your projects.
Setting Up Lighthouse

To get started with the npm version of Lighthouse, Node.js (LTS) must be installed. The npm Lighthouse package allows you to run audits programmatically via the command line or within a Node.js environment.
Global Installation
You can install Lighthouse globally as a command-line interface (CLI) tool using the command:
npm install -g lighthouse
Project-Specific Installation
Alternatively, for project-specific usage, install Lighthouse as a development dependency:
npm install --save-dev lighthouse
Configuration Options
Lighthouse can also be accessed through the Chrome DevTools Lighthouse tab or as a Chrome extension, providing flexible options depending on your workflow. Integration into CI/CD pipelines is possible using Lighthouse CI, which helps prevent performance regressions by setting performance budgets and automating audits.
Configuration options are available for customizing Lighthouse runs. You can control network throttling, CPU throttling, and output formats such as JSON, CSV, or HTML. JSON output is especially useful for exporting, sharing, and programmatic analysis of reports, as well as for version control and efficient report management. You can also specify authentication for testing private pages. The Node CLI offers the most flexibility for advanced usage. For example, the --view flag opens the HTML report that Lighthouse generates automatically in your default browser after running an audit, making it easy to review results.
Once Lighthouse is set up, you can begin running tests to analyze your website’s performance.
Running Lighthouse Tests
Running Lighthouse tests is straightforward. You can audit any URL, public or requiring authentication, using the command:
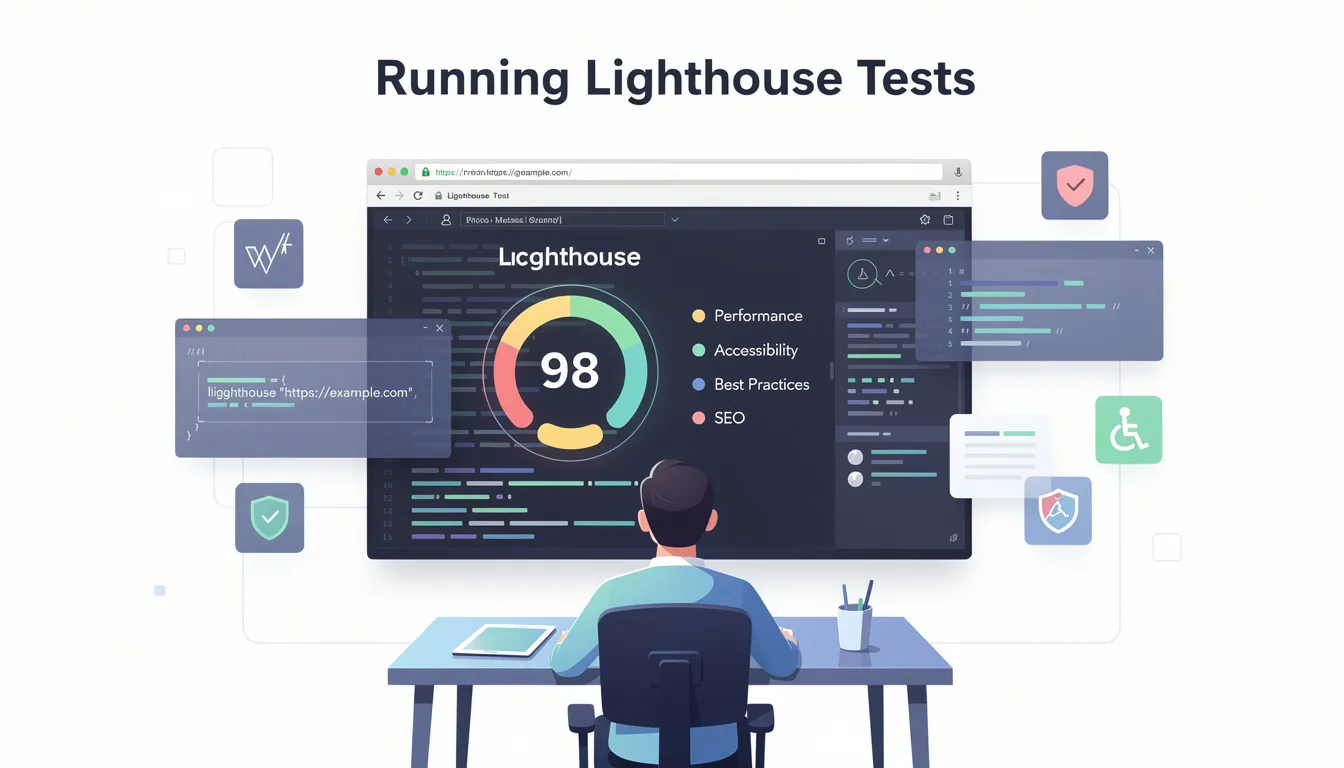
lighthouse https://example.com --view
Running Tests via Chrome DevTools
The --view flag helps by automatically opening the HTML report in your browser once the audit completes. After running a test, Lighthouse generates a report with scores and recommendations for improving performance, accessibility, and SEO.
You can also run Lighthouse tests from the Chrome DevTools Lighthouse tab by selecting the device type (mobile or desktop) and clicking “Analyze page load.” Additionally, Google’s PageSpeed Insights tool runs Lighthouse audits and provides real user data to complement lab metrics.
Lighthouse supports running tests from up to 16 regions worldwide with a single test, enabling you to assess performance globally.
Tips for Accurate Testing
Tip: For more accurate results, run Lighthouse tests in an incognito window to minimize the impact of browser extensions and cached data.
Once you’ve run your tests, you’ll receive a detailed report. Next, let’s explore how to interpret and use these Lighthouse reports.
Understanding Lighthouse Reports
A Lighthouse report provides a detailed analysis of a web page’s performance across several key categories:
Performance
Measures how fast content appears using metrics like Largest Contentful Paint (LCP), Total Blocking Time (TBT), and Cumulative Layout Shift (CLS). Lighthouse measures CPU processing time with the Total Blocking Time metric and visual stability with the Cumulative Layout Shift metric. These metrics are critical for understanding user experience, as they reflect load speed, responsiveness, and visual stability.
Accessibility
Identifies barriers for users with disabilities, such as missing alt text, low color contrast, or improper ARIA attributes, ensuring your site is usable by all visitors.
Best Practices
Evaluates security, code health, and adherence to modern web standards, including HTTPS usage, avoiding deprecated APIs, and ensuring safe resource loading.
SEO
Checks for search engine discoverability factors, including valid meta tags, crawlable links, and proper heading structure to improve your site’s visibility in search results.
Progressive Web App (PWA)
Validates if the site meets Progressive Web App criteria for offline use, installability, and other PWA standards that enhance user engagement and reliability.
Each audit within the report includes a reference explaining why the audit is important and actionable recommendations on how to fix issues. Lighthouse allows users to click on each insight in the report to learn more about the issues affecting page speed and how to improve them. You can use the failed audits in Lighthouse as indicators for how to improve the page.
The Lighthouse report provides a high-level performance score and specific recommendations for improvement, helping developers prioritize optimization efforts effectively.
With a clear understanding of your report, you can now focus on optimizing your website based on Lighthouse’s insights.
Optimizing Web Performance Based on Lighthouse Insights

Lighthouse reports offer practical advice to improve website performance and user experience. Some key optimization strategies include:
-
Removing unused code to eliminate 'dead' JavaScript or CSS in large applications, reducing payload size and improving load times.
-
Eliminating render-blocking resources by deferring non-critical CSS or JavaScript.
-
Implementing caching strategies based on the report's suggestions to store static assets locally on the user's device, enabling faster return visits.
-
Using modern image formats like WebP or AVIF and enabling lazy-loading to reduce initial load times.
Following these recommendations not only boosts performance but also enhances SEO and accessibility.
After optimizing your site, you can use additional tools like Pagespeed Insights to further refine your web performance.
Pagespeed Insights and Optimization
Pagespeed Insights is a powerful tool from Google that leverages Lighthouse to analyze the performance of any web page and provide actionable optimization recommendations. To get started, simply enter the URL of the web page you want to analyze and click “Analyze.” Pagespeed Insights will run Lighthouse tests on your site and generate a comprehensive report that includes a performance score, as well as detailed suggestions for improving page load speed, accessibility, and SEO.
Web developers can use the insights from Pagespeed Insights to identify specific areas where their web pages may be underperforming. The report highlights opportunities to optimize images, reduce unused code, and improve server response times, all of which contribute to a faster and more efficient website.
By regularly running Lighthouse tests through Pagespeed Insights and reviewing the generated reports, developers can make data-driven decisions to enhance website performance and ensure their pages load quickly for users.
Optimizing your web pages based on Pagespeed Insights not only improves user experience but also boosts your site’s visibility in search engine results. With clear, prioritized recommendations, web developers can systematically address performance bottlenecks and achieve higher Lighthouse scores, leading to better SEO and increased engagement.
Once you’ve reviewed and implemented these optimizations, sharing and collaborating on Lighthouse reports can help your team stay aligned.
Sharing and Collaborating on Lighthouse Reports
Lighthouse reports can be saved as JSON or HTML files and shared with team members for collaboration. The npm version of Lighthouse can generate reports in JSON or CSV formats for easier integration with analytics tools.
You can share reports online using the Lighthouse Viewer, which allows uploading and viewing reports in a browser. Additionally, reports can be shared as GitHub gists, providing version control and easy access for development teams.
These sharing capabilities help teams track performance improvements, coordinate optimization efforts, and maintain transparency.
If you encounter issues during testing, the next section will help you troubleshoot common problems.
Troubleshooting Common Issues
When you run Lighthouse tests, you may occasionally encounter issues that can affect the accuracy or usefulness of your Lighthouse report. One frequent challenge is slow page load times, which can be caused by large images, excessive JavaScript, or slow server responses.
To pinpoint these bottlenecks, web developers can use the Lighthouse tab in Chrome DevTools to analyze the page load process in detail, examining which resources are slowing down the site.
Another common issue is failed audits within the Lighthouse report. These failures can result from incorrect configuration options, missing dependencies, or problems with the web page itself. To troubleshoot, check the error messages provided in the Lighthouse report and consider running Lighthouse from the command line with debug flags enabled. This approach can reveal more detailed information about what went wrong during the test.
By systematically analyzing the results and adjusting configuration options as needed, web developers can resolve issues and ensure that their Lighthouse tests provide reliable, actionable insights. Regular troubleshooting and refinement help maintain accurate performance monitoring and support ongoing website optimization.
For those looking to go further, advanced Lighthouse topics can help you tailor your testing and automation.
Advanced Lighthouse Topics
Advanced topics include:
-
Custom Audits and Plugins: Extend Lighthouse functionality to test specific metrics or industry standards by creating custom audits or using a lighthouse plugin. A lighthouse plugin is an extendable module that enhances Lighthouse's auditing capabilities, allowing you to add custom checks, integrate real-user data, and target specific performance metrics.
-
Throttling and Configuration: Customize network and CPU throttling settings for more accurate simulations that reflect real-world user conditions.
-
Integration with CI/CD Pipelines: Automate Lighthouse tests to catch regressions early and enforce performance budgets.
-
Using Lighthouse Programmatically: Leverage the Node module to incorporate Lighthouse audits into custom workflows, enabling automated testing and reporting.
By exploring these advanced features, you can further integrate Lighthouse into your development process and ensure ongoing web performance improvements.
Next, let’s review best practices for web performance testing to maximize your results.
Best Practices for Web Performance Testing
To maximize the benefits of Lighthouse tests, web developers should adopt a set of best practices for web performance testing. Start by running Lighthouse tests regularly—using tools like Pagespeed Insights, the Lighthouse Node module, or the Lighthouse tab in Chrome DevTools—to continuously monitor website performance and catch issues early.
Incorporating real user data, such as metrics from the Chrome User Experience Report, can provide valuable context and help prioritize optimizations that have the greatest impact on actual visitors.
When reviewing a Lighthouse report, focus on the most critical issues affecting page load time and user experience. Use the actionable recommendations to guide your optimization efforts, addressing high-priority items first.
Leveraging the Node module allows for automated testing and integration into your development workflow, ensuring that performance remains a top priority throughout the lifecycle of your web page.
Extend Lighthouse’s capabilities by using plugins or creating custom audits tailored to your specific needs. Sharing reports online and collaborating with other web developers can foster knowledge sharing and keep your team up-to-date with the latest tools, services, and best practices.
By following these strategies, you can use Lighthouse tests to drive continuous improvement, enhance website performance, and deliver a superior experience to your users.
For teams seeking more robust solutions, several commercial tools build on Lighthouse to offer enhanced monitoring and reporting.
Commercial Tools Using Lighthouse
Several commercial services build on Lighthouse to offer enhanced monitoring and reporting:
-
Calibre: Comprehensive performance monitoring platform with Lighthouse integration.
-
DebugBear: Website monitoring with real user data and advanced analysis.
-
Treo: Lighthouse as a Service offering regression testing and geographic testing.
-
PageVitals: Combines Lighthouse, Chrome UX Report (CrUX), and field testing.
-
Screpy: Web analysis tool powered by Lighthouse that can analyze all pages of websites.
-
SpeedCurve: Aggregates Lighthouse scores across multiple pages and sites.
-
Foo: Lighthouse-as-a-service with monitoring and historical reporting.
-
DeploymentHawk: Automated site auditing tool powered by Lighthouse.
-
Lighthouse Metrics: Offers free global one-time tests and paid performance monitoring.
-
Auditzy: Website auditing and monitoring tool analyzing pre-user journey.
-
DTEKT: Website performance and uptime monitoring service using Lighthouse.
-
SpeedVitals: Lighthouse-powered tool measuring web performance across devices.
These services provide additional features such as historical tracking, alerting, multi-region testing, and integration with development workflows, helping teams maintain high website quality efficiently.
As you consider these tools, remember that the right solution depends on your team’s needs and workflow.
Conclusion and Next Steps
Lighthouse is an essential tool for web developers seeking to optimize website performance, accessibility, SEO, best practices, and PWA compliance. By running tests, analyzing reports, and implementing recommendations, you can enhance user experience and search engine rankings.
The importance of Lighthouse for SEO and websites cannot be overstated. Search engines like Google prioritize websites that load quickly, are accessible, and follow best practices, all of which are core areas evaluated by Lighthouse. A well-optimized website improves crawlability, making it easier for search engines to discover and index your content effectively. Lighthouse audits critical SEO factors such as valid meta tags, structured data, crawlable links, and proper heading hierarchy, ensuring your site meets the technical requirements to rank well.
Moreover, Lighthouse measures Core Web Vitals—key user-centric metrics like Largest Contentful Paint (LCP), Total Blocking Time (TBT), and Cumulative Layout Shift (CLS)—that Google uses as ranking signals. Optimizing these metrics leads to faster page load times, smoother interactions, and visual stability, all of which contribute to better user engagement and lower bounce rates. A better user experience, validated by Lighthouse scores, directly correlates with improved search engine visibility and higher organic traffic.
By integrating Lighthouse into your development and monitoring workflows, you can continuously assess and enhance your website’s SEO health and overall quality. This proactive approach helps you stay ahead of algorithm updates and maintain a competitive edge in search rankings.
To get the most out of your web performance and SEO efforts, consider partnering with experts who can help you interpret Lighthouse reports and implement effective optimizations. Sterling Media & Communications (SMC) specializes in delivering on-page, technical and local SEO and comprehensive web performance solutions tailored to your needs. Visit their website at smcww.co.uk to learn more about how they can support your digital success.
If you have questions about npm Lighthouse or want to learn more, check out the FAQs below.
Frequently Asked Questions (FAQs)
Q: What is npm Lighthouse?
A: npm Lighthouse is the Node.js package version of Google Lighthouse, allowing developers to run audits programmatically via the command line or within Node.js environments for automated testing.
Q: Can Lighthouse test private or authenticated pages?
A: Yes, Lighthouse supports testing pages requiring authentication by configuring credentials in the CLI or using custom scripts.
Q: How does Lighthouse improve SEO?
A: Lighthouse audits SEO factors such as meta tags, crawlable links, and proper heading structures to ensure search engines can effectively discover and index your site.
Q: What formats can Lighthouse reports be generated in?
A: Lighthouse can generate reports in HTML, JSON, and CSV formats, providing flexibility for analysis and integration with other tools.
Q: How can I automate Lighthouse testing in my development workflow?
A: You can integrate Lighthouse into CI/CD pipelines using Lighthouse CI or programmatically run audits with the npm Lighthouse package to automate performance monitoring.
Q: Is Lighthouse a free tool?
A: Yes, Lighthouse is a free, open-source tool developed by Google, available to all web developers.
Q: What are core web vitals, and why are they important?
A: Core web vitals are key performance metrics measured by Lighthouse, including Largest Contentful Paint (LCP), Total Blocking Time (TBT), and Cumulative Layout Shift (CLS), which directly impact user experience and SEO.
For more detailed guidance on optimizing your website’s performance and maximizing the benefits of Lighthouse, reach out to Sterling Media & Communications at smcww.co.uk. Their expert team is ready to help you achieve faster, more accessible, and SEO-friendly web experiences.

0 comments